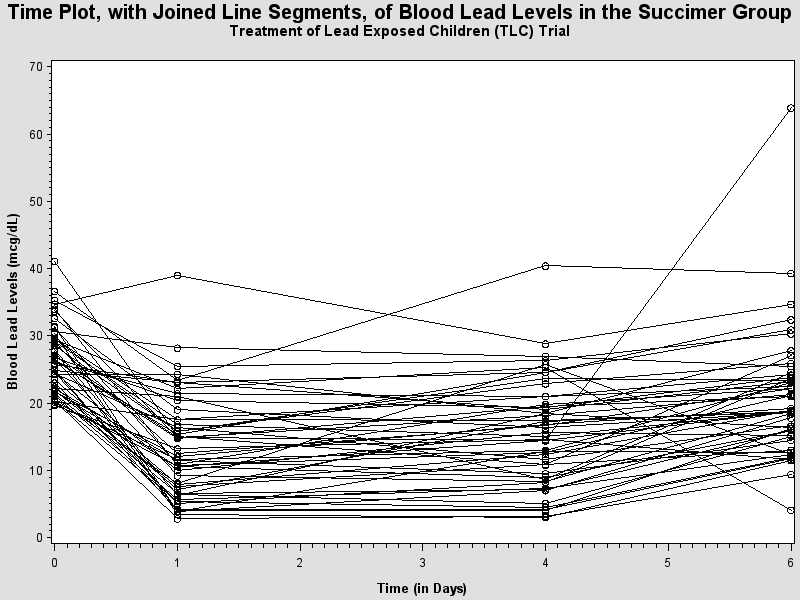
| Time Plot, with Joined Line Segments, of Blood Lead Levels in the Succimer Group |
| Treatment of Lead Exposed Children (TLC) Trial |
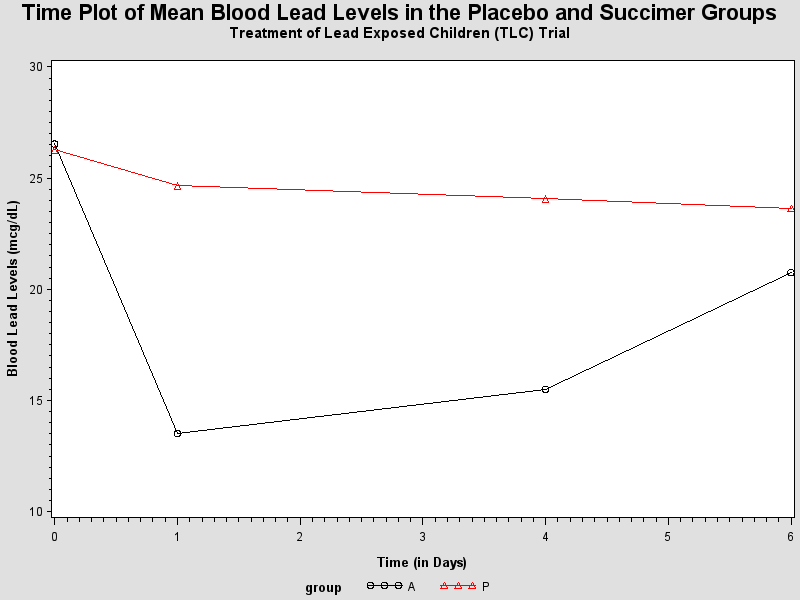
| Analysis Variable : y | ||||
|---|---|---|---|---|
| time | group | N Obs | N | Mean |
| 0 | A | 50 | 50 | 26.5400000 |
| P | 50 | 50 | 26.2720000 | |
| 1 | A | 50 | 50 | 13.5220000 |
| P | 50 | 50 | 24.6600000 | |
| 4 | A | 50 | 50 | 15.5140000 |
| P | 50 | 50 | 24.0700000 | |
| 6 | A | 50 | 50 | 20.7620000 |
| P | 50 | 50 | 23.6460000 | |