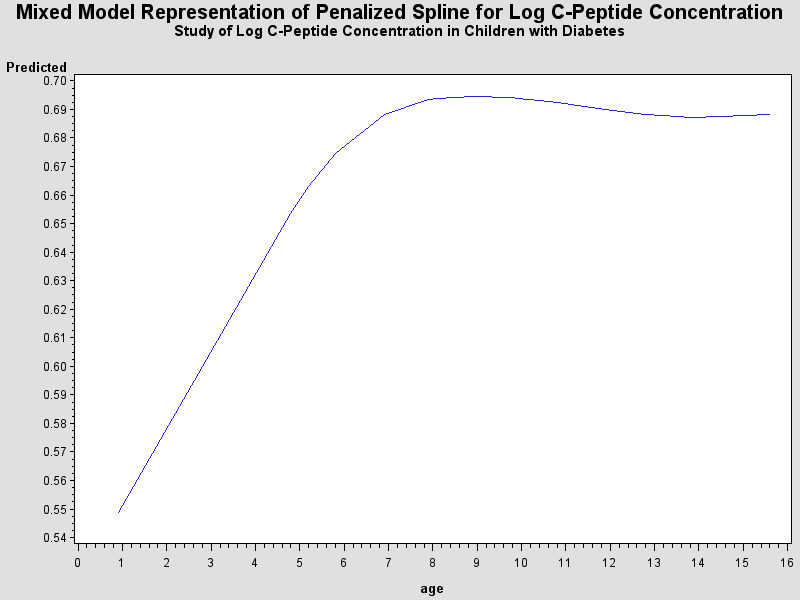
| Mixed Model Representation of Penalized Spline for Log C-Peptide Concentration |
| Study of Log C-Peptide Concentration in Children with Diabetes |
| Model Information | |
|---|---|
| Data Set | WORK.DIABETES |
| Dependent Variable | logc |
| Covariance Structure | Banded Toeplitz |
| Estimation Method | REML |
| Residual Variance Method | Profile |
| Fixed Effects SE Method | Model-Based |
| Degrees of Freedom Method | Containment |
| Dimensions | |
|---|---|
| Covariance Parameters | 2 |
| Columns in X | 2 |
| Columns in Z | 10 |
| Subjects | 1 |
| Max Obs Per Subject | 43 |
| Number of Observations | |
|---|---|
| Number of Observations Read | 43 |
| Number of Observations Used | 43 |
| Number of Observations Not Used | 0 |
| Iteration History | |||
|---|---|---|---|
| Iteration | Evaluations | -2 Res Log Like | Criterion |
| 0 | 1 | -101.62650626 | |
| 1 | 2 | -107.15085960 | 0.00000011 |
| 2 | 1 | -107.15087002 | 0.00000000 |
| Convergence criteria met. |
| Covariance Parameter Estimates | ||||
|---|---|---|---|---|
| Cov Parm | Estimate | Standard Error | Z Value | Pr > Z |
| Variance | 0.000104 | 0.000128 | 0.81 | 0.2084 |
| Residual | 0.003069 | 0.000699 | 4.39 | <.0001 |
| Fit Statistics | |
|---|---|
| -2 Res Log Likelihood | -107.2 |
| AIC (smaller is better) | -103.2 |
| AICC (smaller is better) | -102.8 |
| BIC (smaller is better) | -107.2 |
| Null Model Likelihood Ratio Test | ||
|---|---|---|
| DF | Chi-Square | Pr > ChiSq |
| 1 | 5.52 | 0.0188 |
| Solution for Fixed Effects | |||||
|---|---|---|---|---|---|
| Effect | Estimate | Standard Error | DF | t Value | Pr > |t| |
| Intercept | 0.5246 | 0.03173 | 31 | 16.53 | <.0001 |
| age | 0.02689 | 0.006929 | 31 | 3.88 | 0.0005 |
| Solution for Random Effects | |||||
|---|---|---|---|---|---|
| Effect | Estimate | Std Err Pred | DF | t Value | Pr > |t| |
| bf1 | -0.00773 | 0.008908 | 31 | -0.87 | 0.3923 |
| bf2 | -0.00820 | 0.009147 | 31 | -0.90 | 0.3768 |
| bf3 | -0.00629 | 0.009229 | 31 | -0.68 | 0.5006 |
| bf4 | -0.00387 | 0.009086 | 31 | -0.43 | 0.6734 |
| bf5 | -0.00157 | 0.009155 | 31 | -0.17 | 0.8646 |
| bf6 | -0.00115 | 0.009112 | 31 | -0.13 | 0.9005 |
| bf7 | -0.00046 | 0.009014 | 31 | -0.05 | 0.9594 |
| bf8 | 0.000616 | 0.009261 | 31 | 0.07 | 0.9474 |
| bf9 | 0.001050 | 0.009486 | 31 | 0.11 | 0.9125 |
| bf10 | 0.001376 | 0.009884 | 31 | 0.14 | 0.8902 |
| Type 3 Tests of Fixed Effects | ||||
|---|---|---|---|---|
| Effect | Num DF | Den DF | F Value | Pr > F |
| age | 1 | 31 | 15.06 | 0.0005 |