Chapter 5, Section 5.4
Treatment of Lead Exposed Children Trial (TLC)
> library(foreign)
> ds <- read.dta("tlc.dta")
> tlclong <- reshape(ds, idvar="id", varying=c("y0","y1","y4","y6"),
+ v.names="y", timevar="time", time=1:4, direction="long")
> attach(tlclong)
> week <- time
> week[time==1] <- 0
> week[time==2] <- 1
> week[time==3] <- 4
> week[time==4] <- 6
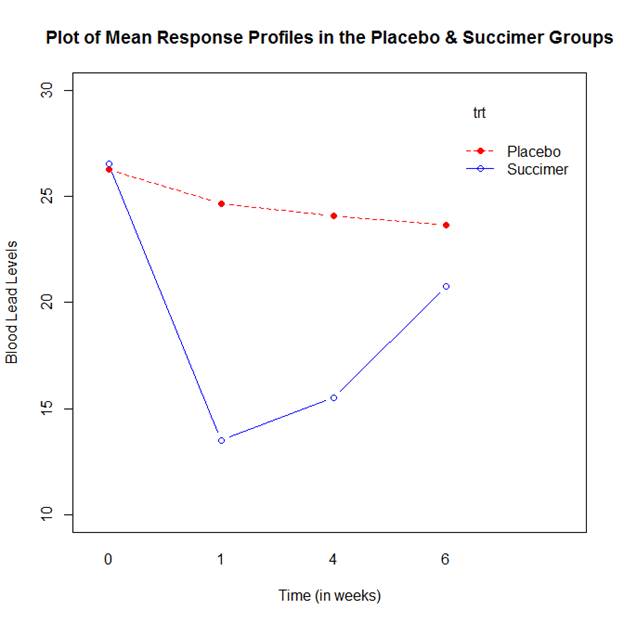
> interaction.plot(week, trt, y, type="b", pch=c(19,21), ylim=c(10, 30),
+ xlab="Time (in weeks)", ylab="Blood Lead Levels",
+ main="Plot of Mean Response Profiles in the Placebo & Succimer Groups",
+ col=c(2,4))
> week.f <- factor(week, c(0,1,4,6))
> library(nlme)
> model <- gls(y ~ trt*week.f, corr=corSymm(, form= ~ time | id),
+ weights = varIdent(form = ~ 1 | week.f))
> summary(model)
Generalized least squares fit by REML
Model: y ~ trt * week.f
Data: NULL
AIC BIC logLik
2452.076 2523.559 -1208.038
Correlation Structure: General
Formula: ~time | id
Parameter estimate(s):
Correlation:
1 2 3
2 0.571
3 0.570 0.775
4 0.577 0.582 0.581
Variance function:
Structure: Different standard deviations per stratum
Formula: ~1 | week.f
Parameter estimates:
0 1 4 6
1.000000 1.325881 1.370473 1.524828
Coefficients:
Value Std.Error t-value p-value
(Intercept) 26.272 0.7102870 36.98787 0.0000
trtSuccimer 0.268 1.0044975 0.26680 0.7898
week.f1 -1.612 0.7919161 -2.03557 0.0425
week.f4 -2.202 0.8149207 -2.70210 0.0072
week.f6 -2.626 0.8885228 -2.95547 0.0033
trtSuccimer:week.f1 -11.406 1.1199385 -10.18449 0.0000
trtSuccimer:week.f4 -8.824 1.1524720 -7.65659 0.0000
trtSuccimer:week.f6 -3.152 1.2565609 -2.50843 0.0125
Correlation:
(Intr) trtScc wek.f1 wek.f4 wek.f6 trS:.1 trS:.4
trtSuccimer -0.707
week.f1 -0.218 0.154
week.f4 -0.191 0.135 0.680
week.f6 -0.096 0.068 0.386 0.385
trtSuccimer:week.f1 0.154 -0.218 -0.707 -0.481 -0.273
trtSuccimer:week.f4 0.135 -0.191 -0.481 -0.707 -0.272 0.680
trtSuccimer:week.f6 0.068 -0.096 -0.273 -0.272 -0.707 0.386 0.385
Standardized residuals:
Min Q1 Med Q3 Max
-2.1756424 -0.6849970 -0.1515552 0.5294182 5.6327491
Residual standard error: 5.022487
Degrees of freedom: 400 total; 392 residual
> anova(model)
Denom. DF: 392
numDF F-value p-value
(Intercept) 1 2583.7978 <.0001
trt 1 4.2267 0.0405
week.f 3 61.4938 <.0001
trt:week.f 3 35.9293 <.0001